 The second part of report points to narrow the search for hospitals with critical needs for money allocation for high asthma hospitalization rates. This map shows that Alameda County has the highest rates in the San Francisco Bay Area of somwhere between 12.85% and 17.8%. This suggest that we might have to take a closer look a Alameda County.
 The second map in this set shows a comparison of the two types of households which have been shown to be at risk. Both Black and Hispanic Households are compared with Asthma Hospitalization rates. There is correlelation in both groups. However, you can see the much higher percentages of black households in correlation with the high hospitalization rates of Alameda County. This helps us to focus in on black populations of Alameda County.
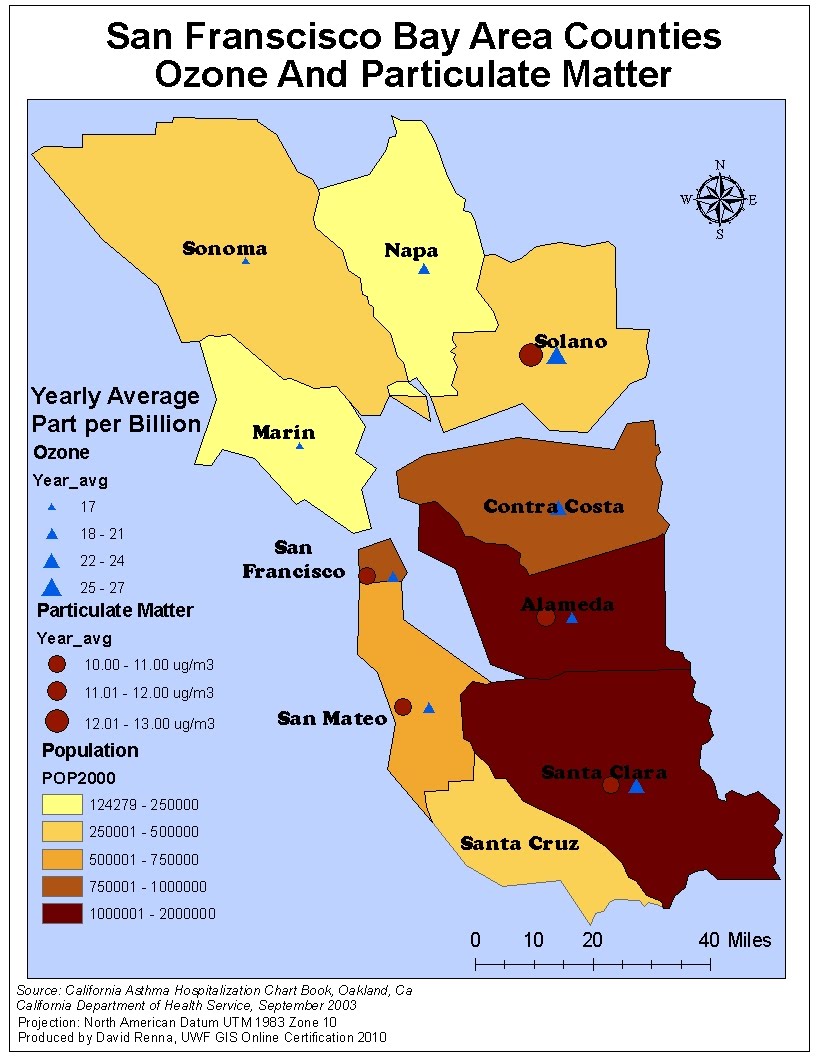 Now we must look at Ozone levels and Particulate Matter levels of the San Francisco Bay Area Counties. You can see the relative high ozone levels in both Santa Clara and Alameda Counties.
The yearly average in both counties is about 22-24 part per billion which is considered high in our research. Secondly, you can see the high particualte matter levels in the four counties of San Francisco, San Mateo, Santa Clara, and Alameda. So We now know that the Southern portion of the study area have high concentrations of 11-12 ug/m3 of particulate matter. At the same time, we can see the high ozone levels of the South West region of the study area.
 Finally, we transpose the ozone and particulate matter data on the map of Asthma Hospitalizaiton rates. This finalizes the need for a closer look at Alameda County.
No comments:
Post a Comment